
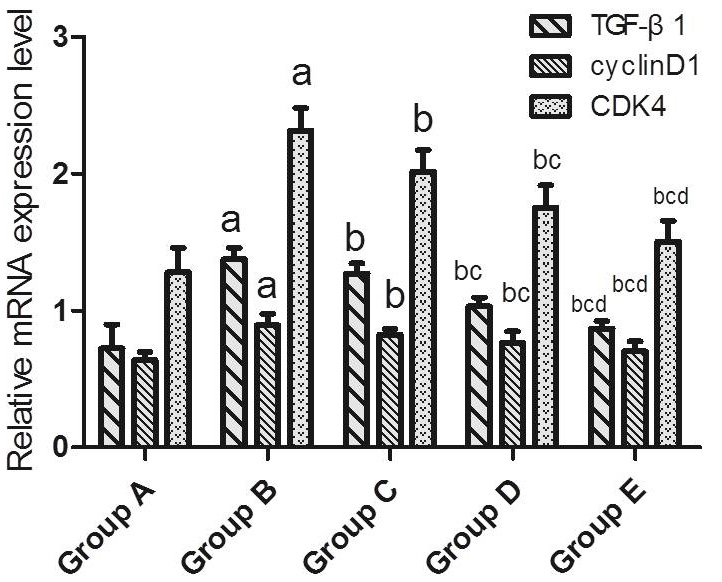
Fig. 3.
The effect of 5-FU on the expression levels of TGF-β1, cyclinD1, and CDK4 mRNA in miniature pig bile duct scar fibroblasts (n=3). Compared with group A, aP <0.05; compared with group B, bP <0.05; compared with group C, cP <0.05; and compared with group D, dP <0.05.